May 23rd, 2017 - S&P 500 e-Mini - Trading Activity - Today's Sim Trade Profit $617
Swing Trade Strategies
Yesterday I mentioned a Swing Trade Strategy that I follow that needs a bit of work to improve it's performance.
This strategy is based on the Naked Close concept.
First of all what is a Naked Close?
There are 2 types of naked closes.
For a show of strength the close of this bar is higher than the high of the previous bar.
I call this a Naked Close Long signal.
For a show of weakness the close of this bar is lower than the low of the previous bar.
I call this a Naked Close Short signal.
In the chart below, a daily chart of the S&P 500 e-mini, the green dots indicate bars with a Naked Close Long signal and the red dots indicate bars with Naked Close Short signals.
You can see that generally the Naked Close proceeds some sort of move in the direction of the signal.
My strategy rules are pretty basic.
Enter on the open of the next bar after the signal.
Exit on the first profitable open
or exit on a reversal
or exit at a $3,000 Stop for Long trades and a $1,600 Stop for Short trades.
While this is a profitable strategy it is not great and needs some work.
The missing link I suspect is a Profit Target.
So, I worked up the tracking spreadsheet to include a Target.
What I discovered is below.

This is a chart of the P&L's when applying targets to the system from 1 to 100 points.

There is s sweet spot from about 35 to 75 points. How do we pick a target to go forward with?
There are a couple of factors to consider.
The first is the daily range. The average daily volatility is somewhere between 20 and 25 points. High volatility days range between 40 and 50 points.
The second is how long we want to stay in a trade. Normally we would like to be out in 2 or 3 days.
The third is having a target that provides steady equity growth over time.
This is a chart of the 70 point target.

This is a chart of the 40 point target.
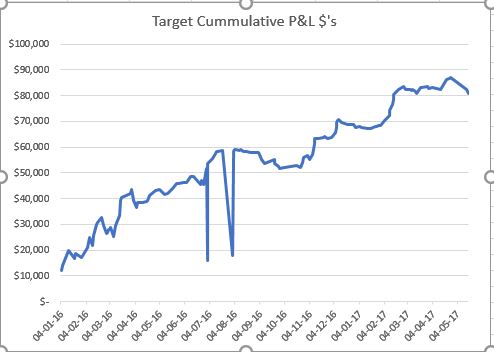
The 40 point target provides a smoother more consistent equity growth, This is important when considering the psychology of the trader.
I suggest we pick a target of 40 points and go forward with that to see what happens in the future.
Pre-Market Simulation
The market dropped about 8 points shortly after the close, but has now rallied and recovered back to the close level.
There was a buy signal on the 10,000 tick that I passed on at 2:08 and another at 2:47.
Both turned out to be good signals.
That was the extent of activity around the European open.
The 2,000 tick pulled back then rallied off a higher short term low into a buy signal at 6:27. Took 2 long @ 2396.75. Target @ 2397.75.
No follow through. 2,000 tick made second test of overnight high, found resistance, then declined into a sell signal. Flipped Trade. Took 5 short @ 2396.25. 2 to cover the longs and 3 for recovery. Target @ 2395.25.
Target hit, we are flat with $88 profit.
Switch to Real Money Account for Open Trade
The 8:24 - 2,000 tick gave us a buy signal on a rally off a higher short term low. Took 2 long @ 2396.50. Target @ 2397.50.
No follow through to the upside and shortly after the open the 2,000 tick gave me a sell signal declining off of a lower short term low. Took 6 short @ 2395.00. 2 to cover the longs and 4 for recovery.
Again no follow through coming up short of my target, then the 2,000 tick rallied into two consecutive buy signals. I took 15 long @ 2396.25. 4 to cover the shorts and 11 for recovery. Target @ 2397.25.
The market did an immediate head spin and declined. At this stage I cannot so another reversal because I am tapped out for margin. Have to hold and see what happens.
The market did rally back to my entry level, but came up short of my target then pulled back, formed a higher short term low then rallied again to about the entry level, pulled back a bit and gave a sell potential signal. This signal failed and the market slowly edged higher into my target.
We are flat with some profit. Will have to figure out the fees etc.
This is the chart of my real trade. I put some notes on it so you can see what I did.
The one mistake I made was not being patient enough with the first short recovery trade.
Did not help that the market was not providing follow through in the first couple of hours of trading.

Switch to Simulation Account.
10:29 - 10,000 tick give us a buy signal. Took 2 long @ 2397.25. Target @ 2398.25.
Target hit, we are flat with $183 profit.
10:43 - 10,000 tick gives us a buy signal. Took 2 long @ 2397.75. Target @ 2398.75.
Target hit, we are flat with $278 profit.
Would have been nice to have this follow through earlier in the day on the real trades.
11:12 - 10,000 tick gives us a buy signal. Took 2 long @ 2399.25. Target @ 2400.25.
No follow through on this one. 2,000 tick pulls back into the previous short term low and gives 2 consecutive sell signals. Flipped trade. Took 8 short @ 2397.25. 2 to cover the longs and 6 for recovery.
Target hit, we are flat with $359 profit.
The 2,000 tick rallied off a lower low to form a lower short term high then declines into a sell signal. 11:48 - Took 2 short @ 2395.75. Target @ 2394.75.
No follow through. 2,000 tick rallies, breaks above previous short term high, gives two consecutive buys signal. Flip trade. Took 7 long @ 2397.50. 2 to cover the shorts and 5 for recovery. Target @ 2398.25.
Target hit, we are flat with $442 profit.
2,000 tick rallies into higher short term high, pulls back, makes higher short term low then rallies into a buy signal. 13:10 - Took 2 long @ 2397.25. Target @ 2398.25.
No follow through. 2,000 tick made a lower short term high then declined into a sell signal. Took 6 short @ 2396.25. 2 to cover the longs and 4 for recovery. Target @ 2395.25.
Once again, no follow through, that time of day.
2,000 tick rallied, broke above previous short term high, gave us 2 consecutive buy signals. Took 15 long @ 2398.00. 4 to cover the shorts and 11 for recovery. Target @ 2399.00.
Finally got follow through on a trade. Target hit, we are flat with $501 profit.
2,000 tick makes a double test of most recent short term high then declines into 2 consecutive sell signals. 14:23 - Took 2 short @ 2397.50. Target @ 2396.50.
Target hit, we are flat with $596 profit.
2,000 tick rallies then declines off lower short term high into sell signal. 14:46 - Short 2 @ 2396.25. Target @ 2395.25.
Just realized the time, Getting close to the close. Moved the target up just to get flat before the close.
Target @ 2396.00 was hit we are flat with $617 profit.
Done for the day.
Daily Summary and Charts


Comments
Post a Comment